Recently on Broadway
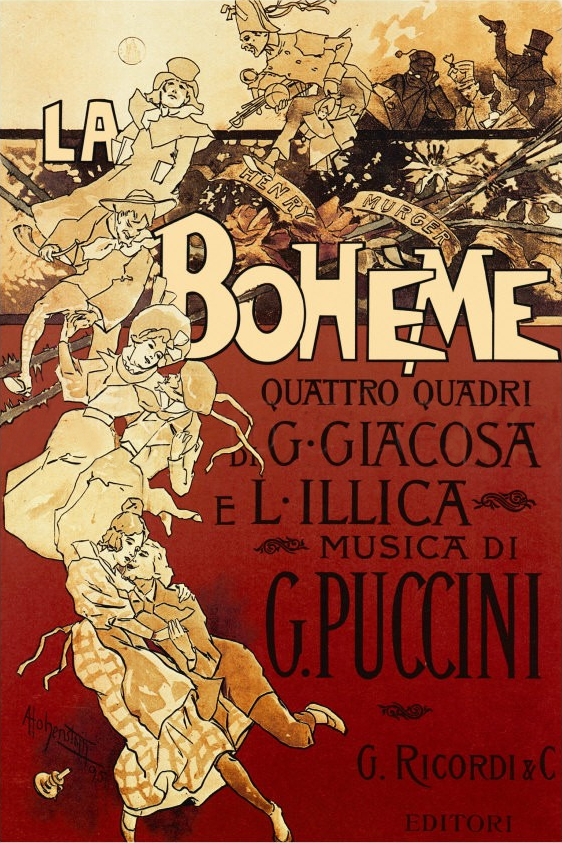
La Bohème
Broadway
Studio 54CBS Studio No. 52 (1946–1977)CBS Radio Playhouse No. 4 (1942–1946)New Yorker Theatre (1939–1942)Federal Music Theatre (1937–1939)Palladium Theatre (1936–1937)Casino de Paris (1933–1936)New Yorker Theatre (1930–1933)Gallo Opera House (1927–1930)1,006 seats
The story
La bohème is an opera in four acts, composed by Giacomo Puccini between 1893 and 1895 to an Italian libretto by Luigi Illica and Giuseppe Giacosa, based on Scènes de la vie de bohème (1851) by Henri Murger. The story is set in Paris around 1830 and shows the Bohemian lifestyle of a poor seamstress and her artist friends.
Read more on Wikipedia (opens in a new tab)How it's doing
Strength score
86/100
Houses are 67.3% full lately, selling about $617,377 a week, with sales trending up (+4.7%/week). Built from real ticket sales — not a profit guess.
Next week, we expect
$877,772
Likely somewhere between $563,018 and $1,192,525, based on the last 31 weeks.
What could move it
- Holiday week — July 4th weekend, Independence Day
- A historically stronger time of year
Closing-risk signal
0/100 · low
Current capacity: 94% · Recent trend: +4.1 pts/wk. A warning sign from empty-and-falling seats — not a prediction that it will close.
Box office (weekly grosses)
Weekly sales & how full
Loading chart…
Recent weeks
| Week ending | Sales | vs last wk | How full | Avg ticket | That week |
|---|---|---|---|---|---|
| Jun 29, 2003 | $832,134 | up ▲ $99,765 | 94% | $65 | — |
| Jun 22, 2003 | $732,369 | up ▲ $167,786 | 86% | $62 | ☔ 4 rainy days |
| Jun 15, 2003 | $564,583 | up ▲ $45,057 | 60% | $69 | ☔ 3 rainy days |
| Jun 8, 2003 | $519,526 | up ▲ $33,440 | 55% | $69 | ☔ 3 rainy days |
TKTS discounts
Not spotted on TKTS yet
This show has been full price on our watch — we'll log it the moment it hits the TKTS discount board, and start tracking how deep the cut goes.
At a glance
TheatreStudio 54CBS Studio No. 52 (1946–1977)CBS Radio Playhouse No. 4 (1942–1946)New Yorker Theatre (1939–1942)Federal Music Theatre (1937–1939)Palladium Theatre (1936–1937)Casino de Paris (1933–1936)New Yorker Theatre (1930–1933)Gallo Opera House (1927–1930)
Opening date—
CategoryBroadway
StatusClosed
Production details, synopsis, poster, and cast come from this show's Playbill page; weekly sales from the Broadway League report via Playbill; discount data from the public TKTS Live board. BoothHistory is an independent tracker, not affiliated with this production, the Broadway League, or TDF.