Times Square booth hours
Hours shift seasonally — confirm on TDF before you go.

Now on Broadway
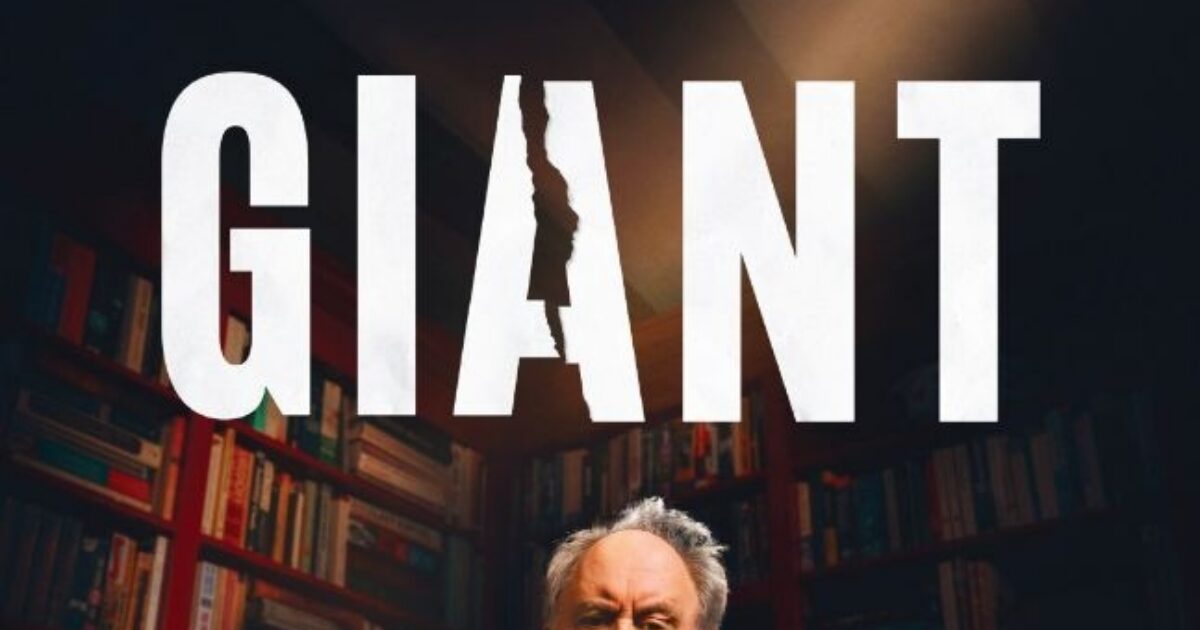
A WORLD-FAMOUS CHILDREN’S AUTHOR UNDER THREAT. A BATTLE OF WILLS IN THE WAKE OF SCANDAL. AND ONE CHANCE TO MAKE AMENDS. Following an acclaimed West End run and three Olivier Awards, GIANT tells the story of Roald Dahl and the true scandal that shook his legacy. Tony, Golden Globe, and Olivier Award-winner John Lithgow ( Conclave , The Crown ) reprises his extraordinary, career-defining performance as Roald Dahl. Written by Mark Rosenblatt , directed by Nicholas Hytner , and designed by Bob Crowley.
Read more on Wikipedia (opens in a new tab)82/100
Houses are 93.9% full lately, selling about $1,215,195 a week, with sales trending up (+0.5%/week). Built from real ticket sales — not a profit guess.
$1,344,143
Likely somewhere between $1,074,835 and $1,613,451, based on the last 14 weeks.
What could move it
1/100 · low
Current capacity: 97% · Recent trend: -0.1 pts/wk. A warning sign from empty-and-falling seats — not a prediction that it will close.
Gold area = weekly ticket sales (left axis); the blue line = how full the house was (right axis, %). Dashed lines mark Tony Awards night.
What the typical seat actually sold for — total box-office sales divided by seats filled, week by week. This is the all-sales average, not the discounted TKTS price.
Source: Broadway League grosses via Playbill · 14 weeks.Every week's full grosses board →
| Week ending | Sales | vs last wk | How full | Avg ticket | That week |
|---|---|---|---|---|---|
| Jun 14, 2026 | $1,382,574 | up ▲ $280,528 | 97% | $179 | ☔ 3 rainy days |
| Jun 7, 2026 | $1,102,046 | down ▼ $48,772 | 96% | $165 | — |
| May 31, 2026 | $1,150,819 | down ▼ $27,949 | 91% | $159 | 🎉 Memorial Day |
| May 24, 2026 | $1,178,768 | down ▼ $91,952 | 92% | $160 | ☔ 4 rainy days |
Industry analytics built from the box-office data — where this show sits on price, what the weeks ahead look like, how it compares to its peers, and the scheduling outlook.
Demand is strong (94% full) and already priced above peers (+57%). Test premium pricing on peak performances (weekends, holiday weeks) where the house sells out.
Production details, synopsis, poster, and cast come from this show's Playbill page; weekly sales from the Broadway League report via Playbill; discount data from the public TKTS Live board. BoothHistory is an independent tracker, not affiliated with this production, the Broadway League, or TDF.
| May 17, 2026 | $1,270,720 | down ▼ $19,385 | 90% | $177 | — |
| May 10, 2026 | $1,290,105 | up ▲ $140,943 | 92% | $175 | 🎉 Truman Day |
| May 3, 2026 | $1,149,162 | down ▼ $48,201 | 96% | $172 | — |
| Apr 26, 2026 | $1,197,363 | down ▼ $18,325 | 98% | $175 | ☔ 3 rainy days |
"vs last wk" is the change in weekly ticket sales. "That week" flags weather and holidays that can nudge attendance up or down.
Suggested avg-ticket band: $176.17 – $188.15
Benchmark and signals only, from public grosses — not a guaranteed outcome. Validate against your own sales pacing before changing prices.
Solid bar = expected weekly gross; lighter bar = upper range. ★ marks a holiday or event week.
Projection is a damped trend adjusted for season + holidays; runway is a straight-line read of the recent capacity decline, not a closing prediction. Planning input only.
Among 5 comparable comparable shows, this show ranks #4 of 5 on weekly gross, #2 on how full, #2 on ticket price.
| Show | Weekly gross | How full | Avg ticket | Trend | Tonys | Reviews | Socials |
|---|---|---|---|---|---|---|---|
| Moulin Rouge! The Musical | $1.3M | 90% | $137.65 | down ▼ 8.1% | — | — | — |
| Ragtime | $1.2M | 100% | $146.35 | up ▲ 2.2% | — | 75 | — |
| Oh, Mary! | $1.2M | 94% | $180.75 | up ▲ 8.1% | — | — | — |
| Giant | $1.2M | 95% | $171.04 | up ▲ 0.3% | — | — | — |
| Aladdin | $1.2M | 92% | $91.83 | down ▼ 3.1% | — | — | — |
Peers are running shows of the same type, nearest in weekly gross. Recent-weeks averages from public grosses; Tonys / reviews / socials populate as those datasets load.
Lean in: Dec 6 (+9%), Dec 13 (+9%), Dec 20 (+9%).
Soft stretch: Nov 1 (-7%), Nov 8 (-7%), Nov 22 (-7%) — plan promos or trims.
★ = a holiday or marquee event lands that week. Green = historically stronger, amber = softer.
| Day | On board | Typical cut | Read |
|---|---|---|---|
| Sun | 1× | 50% off | strongest |
| Thu | 7× | 50% off | |
| Fri | 7× | 50% off | |
| Wed | 12× | 50% off | |
| Sat | 21× | 50% off | softest |
Sun houses hold up best; Sat lean softest — the spot to discount or, on a light week, consider going dark.
Seasonal pattern from this show's own grosses; day strength is inferred from discounting, not measured attendance. Directional planning input — pair with your own sales pacing.
Pick the window you're scheduling and we'll project each week against this show's seasonal pattern and the NYC calendar — so you can load up the strong weeks and plan promotions for the soft ones.
18 weeks (Aug 2 – Nov 29): 5 historically strong, 4 soft, 9 average.
Load up: Aug 2 (+7%), Aug 9 (+7%), Aug 16 (+7%), Aug 23 (+7%).
Support with promos: Nov 1 (-7%), Nov 8 (-7%), Nov 15 (-7%), Nov 22 (-7%).
Run full schedule at standard/premium pricing — protect inventory, minimal discounting.
Standard week — hold your normal schedule and pricing.
Softer demand — support with targeted promotions and watch your weeknight houses.
Standard week — hold your normal schedule and pricing.
Projection only — built from this show's historical seasonality and the recurring NYC calendar (holidays, Broadway Week promos, parades). Pair with your own sales pacing and marketing plans.
How much this show leans on the half-price booth — and where the soft houses are. Built from our own TKTS board history, fused with the weekly grosses.
| Day | On board | Typical cut | Read |
|---|---|---|---|
| Sun | 1× | 50% off | firmest |
| Thu | 2× | 50% off | |
| Fri | 2× | 50% off | |
| Wed | 3× | 50% off | |
| Sat | 4× | 50% off | softest |
"Board presence" = the share of this show's performances (from the grosses) that appeared discounted at TKTS over the last 14 weeks. Discounting is a demand signal, not the whole picture.